Main Description
The Rolling Returns and Volatility Tool is designed to show users the total returns, rolling returns, rolling volatility and rolling returns divided by volatility. This tool is intended as a research tool to give you insight into how a specific stock, ETF or mutual fund is performing.
Settings
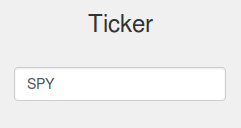
Ticker
Enter the ticker for the fund you want to see the total and price returns for. The total price is the price including all dividends, the plain price returns is just the price of the stock with no dividends added.
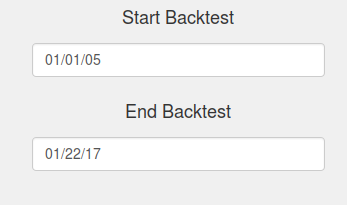
Start/End Simulation Date
The date values to start and end the simulation. If a ticker is unavailable for some of the date range entered the default behavior will be to only test the dates when all tickers are available.
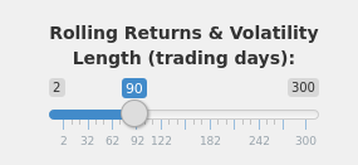
Rolling Returns & Volatility Length
The number of trading days or window size that the rolling returns and volatility are calculated over. A value of 90 trading days will indicate charts will show the 90 day rolling volatility, and the returns chart will show the 90 day rolling average daily return value.
Outputs
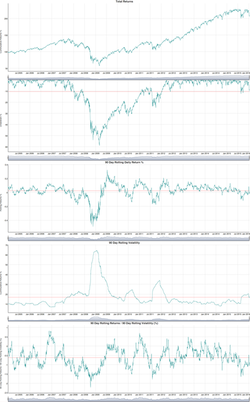
The tool outputs fully interactive charts showing day to day equity (not just monthly data), day to day draw down, transitions from stock to cash symbol, a summary of performance, % allocation per symbol, annual/monthly performance table, and a full trade list.
Downloads
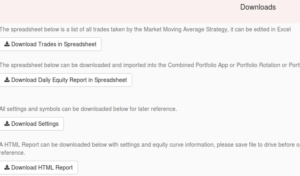
Downloads that are available are a full trade spreadsheet, day by day strategy equity spreadsheet (which can be uploaded to any of our portfolio combination tools), and a list of settings you used to create the results. You may also download an HTML report with fully interactive graphs that you can save and send to others.