Main Description
The Ratio and Correlation Tool allows the user to enter 2 tickers. The tool will then calculate the ratio of those 2 tickers, and the correlation between those 2 tickers.
Settings
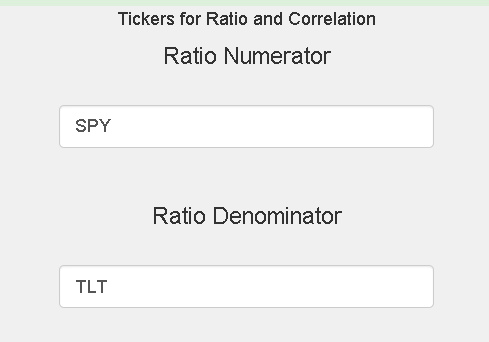
Numerator Ticker
Enter the ticker that you would like to see the ratio and correlation of. The Numerator will be the ticker that the tool divides the price of the denominator ticker.
Denominator Ticker
Enter the ticker that you would like to see the ratio and correlation of. The Denominator will be the ticker that the tool divides the numerator ticker by.
Ratio Output = Numerator Ticker Price / Denominator Ticker Price
Correlation Output = Correlation between numerator ticker and denominator ticker
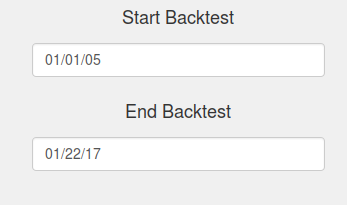
Start/End Simulation Date
The date values to start and end the simulation. If a ticker is unavailable for some of the date range entered the default behavior will be to only test the dates when all tickers are available.
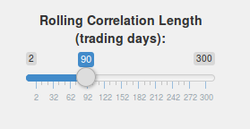
Rolling Correlation Length
The number of trading days that the correlation between the 2 input stocks is calculated over. A large number will use more the stock’s history to calculate the correlation, and a smaller number will show the more recent stock price correlation.
Outputs
The tool outputs fully interactive charts showing day to day equity (not just monthly data), day to day draw down, transitions from stock to cash symbol, a summary of performance, % allocation per symbol, annual/monthly performance table, and a full trade list.
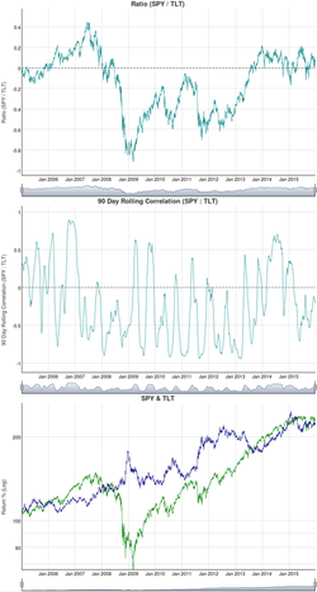
Outputs include: Ratio between the 2 input funds, correlation between the 2 input funds, and a price chart comparing the 2 input fund returns (with dividends) over the period selected.
Downloads
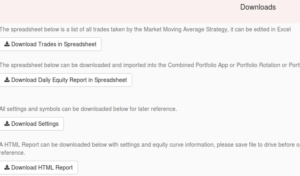
Downloads that are available are a full trade spreadsheet, day by day strategy equity spreadsheet (which can be uploaded to any of our portfolio combination tools), and a list of settings you used to create the results. You may also download an HTML report with fully interactive graphs that you can save and send to others.