Main Description
The Portfolio Timing using Moving Averages Tool allows users to enter a list of symbols and corresponding weightings to construct a standard “Buy and Hold” portfolio and apply a moving average to each fund in the portfolio. When a specific fund is below a moving average, the strategy will move its’ allocation to cash, when that fund goes back above that moving average then that fund will be invested in again.
The Portfolio Timing using Absolute Momentum Tool allows users to enter a list of symbols and corresponding weightings to construct a standard “Buy and Hold” portfolio and apply an absolute momentum filter to each fund in the portfolio. When a specific fund is performing more poorly than the ‘Cash’ fund chosen (typically this is a treasury bill rate, but RotationInvest.com allows users to define this as any fund they would like), then the ‘Cash’ fund is invested in instead of the poorly performing fund.
Settings
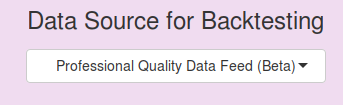
Select Data Feed
Select a data feed to use. The Universal Data Feed has been our default data feed, and provides stock, ETF, and mutual fund data for the US and non-US markets. The Professional Quality Data Feed provides high quality data for US stocks, ETFs, and mutual funds. Additionally there is an option to select historical data, which allows users to select funds with histories that go back as far as 1924.
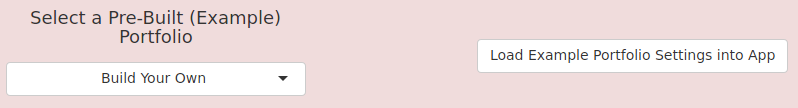
Load a Pre-Built Portfolio
If you would like to load one of our example portfolios into the Risk On Portfolio, select it from the dropdown list, and click the “Load Example Portfolio Settings into App”. This will load settings for the selected portfolio into the application, overwriting the current values. Please keep in mind these are examples, and not financial advice.
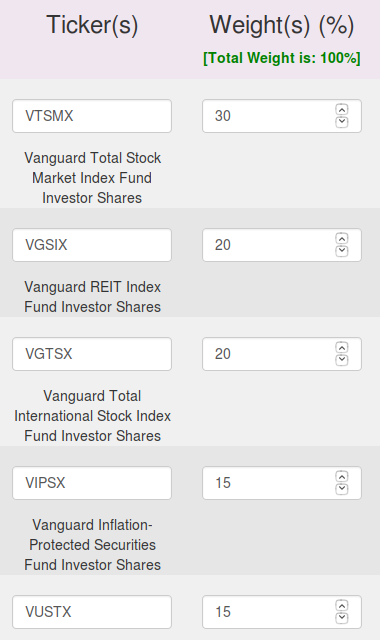
Symbol List
Enter almost any stock, ETF, or mutual fund ticker one per input box into the symbol field. Up to 100.
Weight List
Enter a corresponding weight value in percent for each symbol entered. If a 50 is entered on line 1, and a symbol of SPY is entered on line 1 of the symbol list, this means that 50% of the portfolio will be composed of the ETF: SPY. The total weight is displayed to the right of the weight list near the Run Backtest button, this button will show you the total weighting % of your portfolio, values over 100% (leveraging) is allowed.
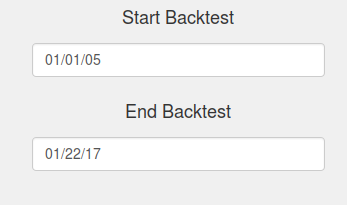
Start/End Simulation Date
The date values to start and end the simulation. If a ticker is unavailable for some of the date range entered the default behavior will be to only test the dates when all tickers are available.
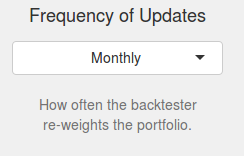
Frequency of Updates
This setting allows the user to choose how often the conditions are evaluated and updates to allocation are made. For example a monthly update means once a month (at the end of the month), the back tester calculates the new weight values based on each one of the 5 algorithms and adjusts the weightings of each ticker to match the weightings reported by each of the algorithms. These weightings will be held until the end of next month when the back tester will evaluate (ask the question) again and re-weight the portfolio according to the new values for each algorithm.
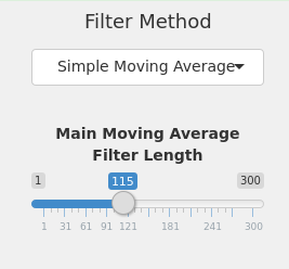
Moving Average Filter [Moving Average Tool Only]
This setting allows the user to choose what type of moving average, and how long the moving average is that will be used to determine if the stock ticker is above or below the moving average. Selections for the moving average type are, simple moving average, exponential, weighted, wilder exponential, double exponential, and look back length. The length of the moving average can be set as well, longer values will result in a slower to react moving average but prevent crossovers from happening too frequently.
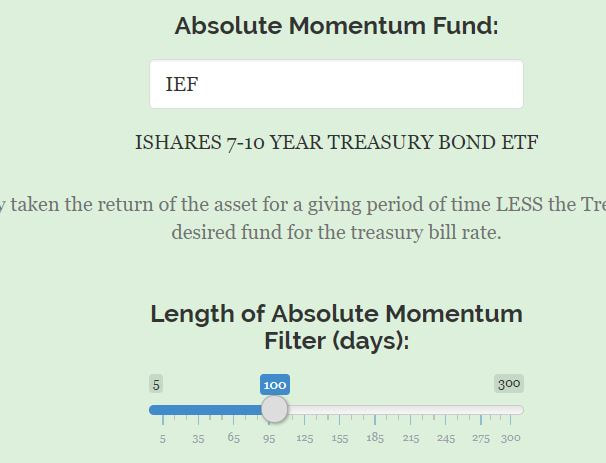
Absolute Momentum Filter [Absolute Momentum Tool Only]
This setting allows the user to choose the fund used for absolute momentum and the length of the comparison for the absolute momentum logic.
Fund: The fund chosen here will be compared to each fund in the portfolio, if this fund is doing better (return %) over the period of time (see length below) then this fund will be invested in instead of the fund in the main portfolio.
Length: The length defined here is the length of time to compare each fund in the portfolio to the ‘Absolute Momentum Fund’ chosen here.
For example if 100 days is chosen as the length, IEF is the absolute momentum fund, and the portfolio is 60% SPY and 40% MDY: If IEF has a higher % return over the past 100 days than SPY but not MDY – then IEF will take over 60% of the portfolio from SPY, so the allocation will be IEF 60% and MDY 40%.
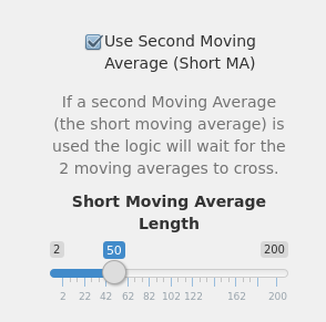
Second Moving Average Filter [Moving Average Tool Only]
You can enable the second moving average filter by checking the box ‘Use Second Moving Average’. A popup will now allow you to setup the length of the 2nd moving average, keep in mind this should be shorter than the main moving average, same moving average method is used for both moving averages. The second moving average allows you to define a moving average that the main moving average (above) has to cross over to be considered above or below, instead of just using the price of the fund entered.
For example, without a second moving average (box deselected) if the price of the stock at the end of the period is 57.00, and the moving average (main ma, shown above) is at 57.10 then the moving average tool will consider the stock below the moving average and invest in the cash fund instead.
If we are using the second moving average (box selected) the price is 57.00, the main moving average is 57.10, but the second moving average value (50 day moving average show to the right) is 57.20, then the tool will consider the stock above the moving average since we are comparing the second moving average price of 57.20 to the main moving average with value 57.10 and that value is above, so therefore we are in the stock fund.
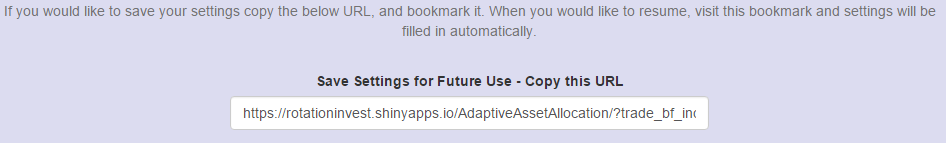
Save Your Settings For Later
At the bottom of the settings area there is a URL, bookmark or save this URL and you will automatically be able to load and save all your settings automatically, without re-entering it every time.
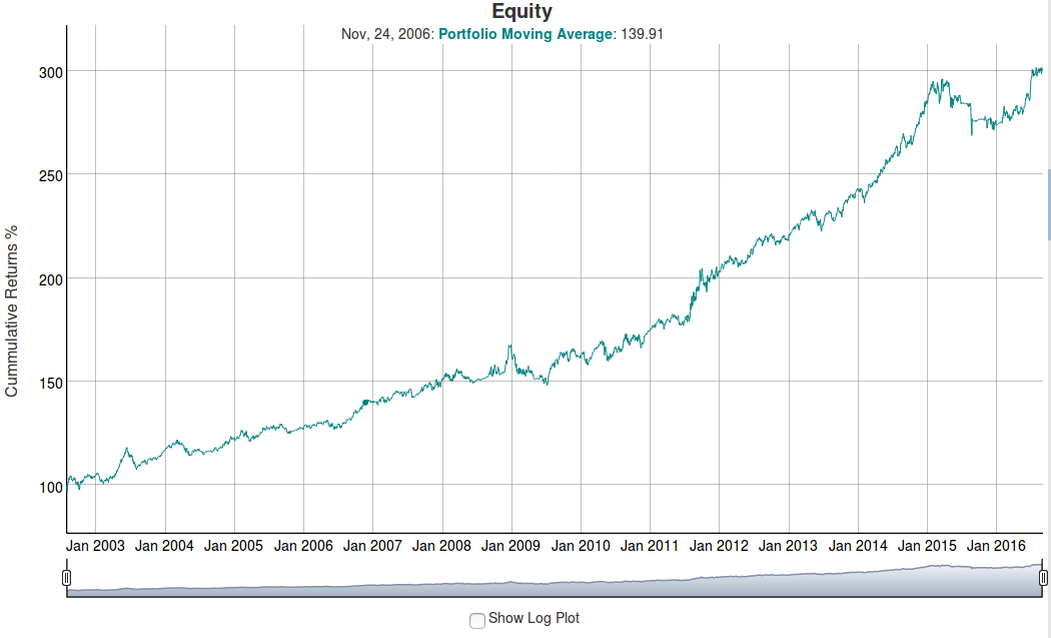
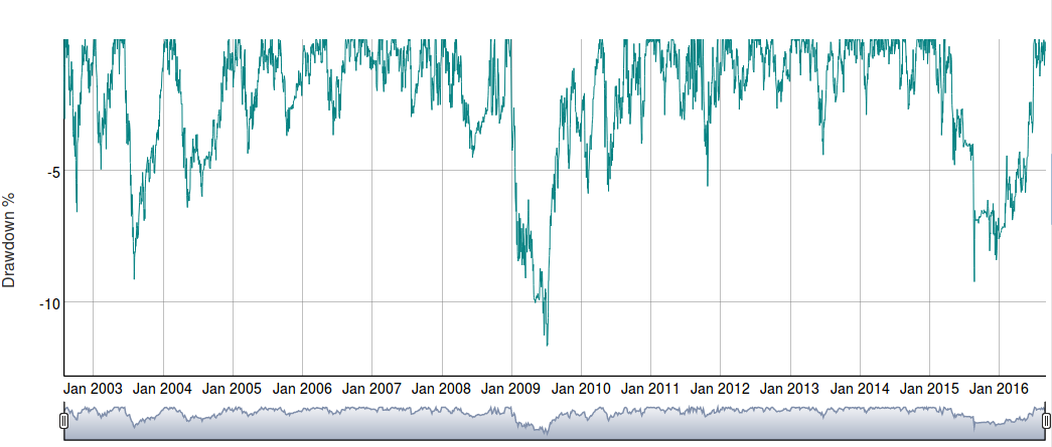
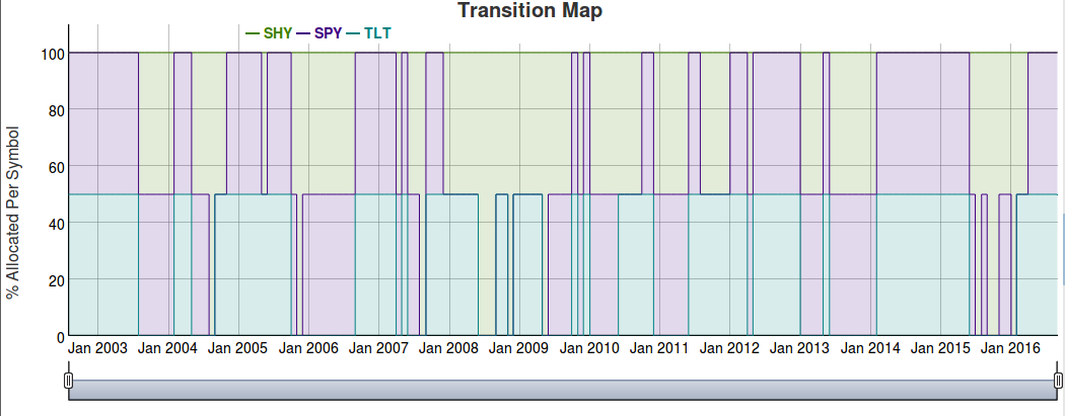
Outputs
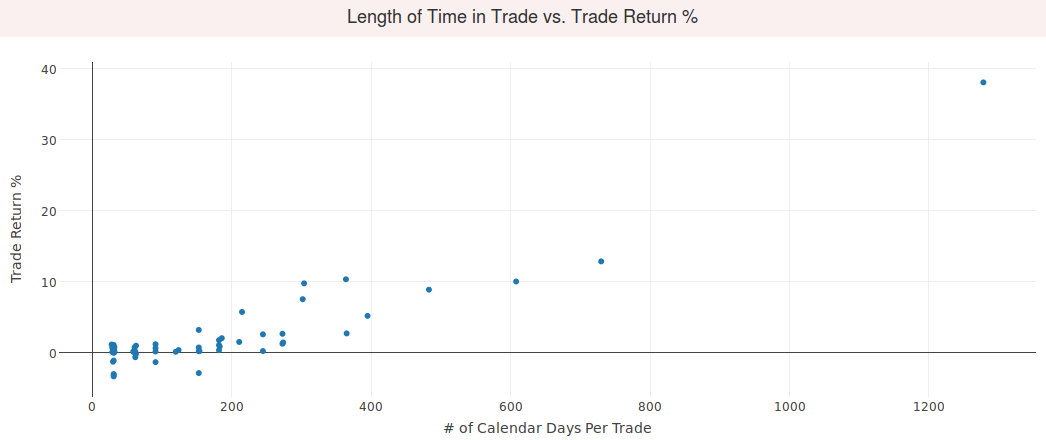
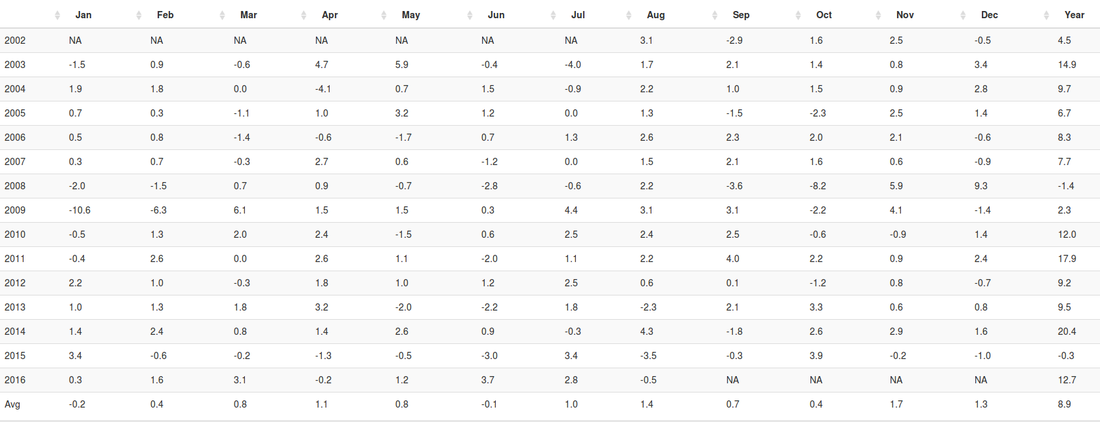
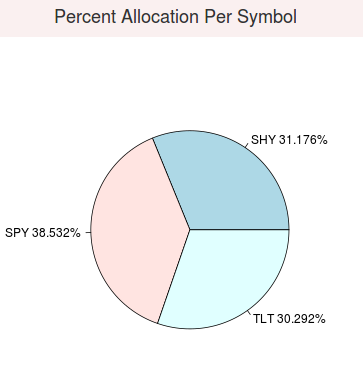
The tool outputs fully interactive charts showing day to day equity (not just monthly data), day to day draw down, transitions from stock to cash symbol, a summary of performance, % allocation per symbol, annual/monthly performance table, and a full trade list.

Downloads
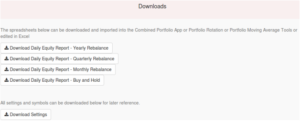
Downloads that are available are a full trade spreadsheet, day by day strategy equity spreadsheet (which can be uploaded to any of our portfolio combination tools), and a list of settings you used to create the results. You may also download an HTML report with fully interactive graphs that you can save and send to others.